Table of Contents
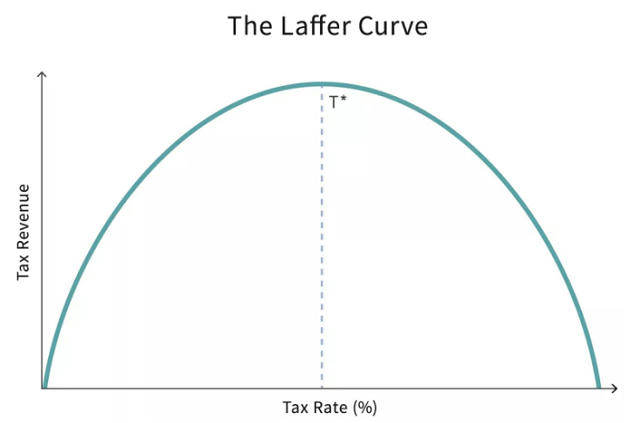
LAFFER CURVE
- Developed in 1974 by economist Arthur Laffer.
- It show the relationship between tax rates and the amount of tax revenue collected by governments.
- Tax revenues change when the tax rate is either increased or decreased.
- Inverted-U shape.
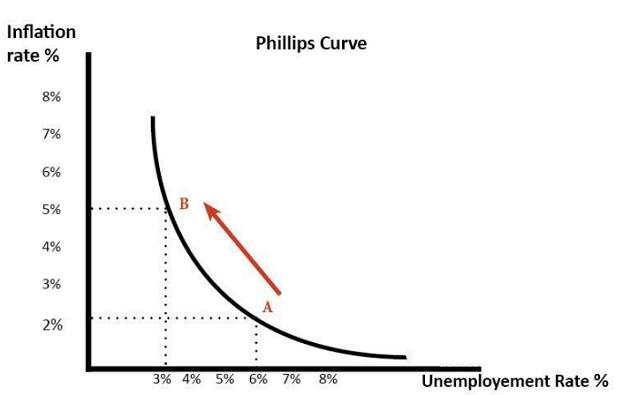
PHILLIPS CURVE
- Developed in 1958 by economist William Phillips.
- It shows inverse relationship between unemployment rate and inflation.
- High levels of employment can be achieved only at high levels of inflation.
- Dilemma for policy makers. (Inflation hurts poor the most)
- But it failed to justify the stagflation in the 1970s.
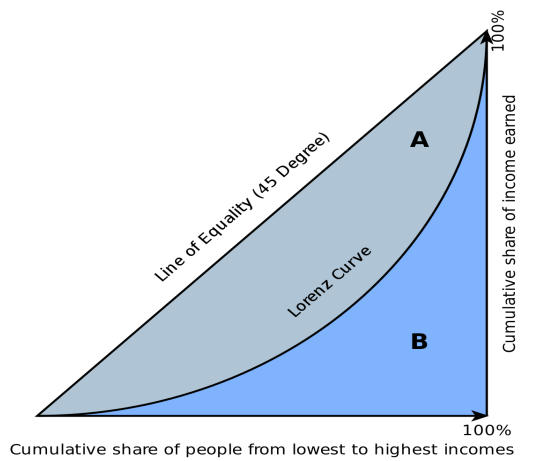
LORENZ CURVE AND GINI COEFFICIENT
- Developed in 1906 by Max Lorenz.
- It is a graphical representation of income inequality.
- Farther the curve from baseline, higher will be the inequality.
- Gini coefficient express the extent of inequality in a single figure. It can range from 0 (or 0%) to 1 (or 100%).
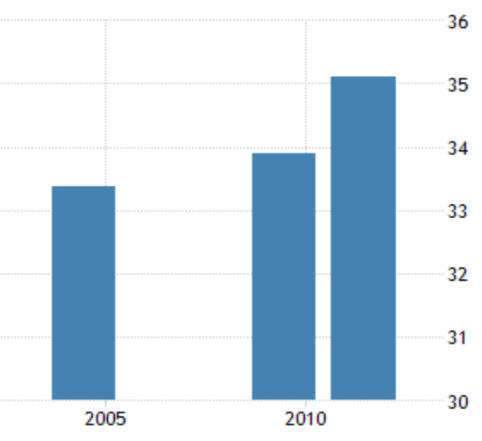
India – GINI index
- GINI index in India was reported at 35.1 in 2011, according to the World Bank collection of development indicators.
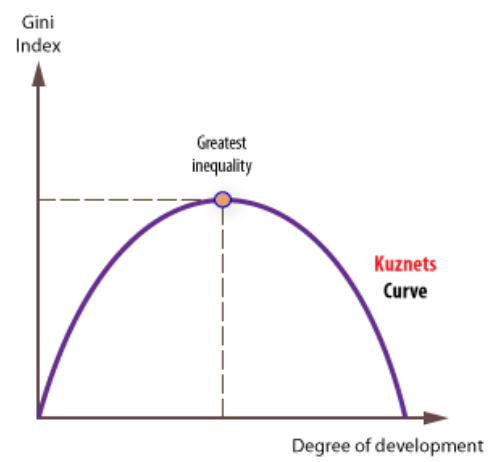
KUZNETS CURVE
- Developed in 1950s by economist Simon Kuznets.
- It shows the relationship between Growth & Inequality.
- Economic growth initially leads to greater inequality, followed later by the reduction of inequality.
- Inverted-U shape.
1. Laffer Curve A) Unemployment rate and inflation
2. Phillips Curve B) Change in tax revenue
3. Lorenz Curve C) Growth & Inequality
4. Kuznets curve D) Income inequality
- Match the correct IPC section.
- 1 2 3 4
- (a) A B C D
- (b) B A D C
- (c) B A C D
- (d) D A B C
Latest Burning Issues | Free PDF


 WhatsApp