
Table of Contents

IN NEWS
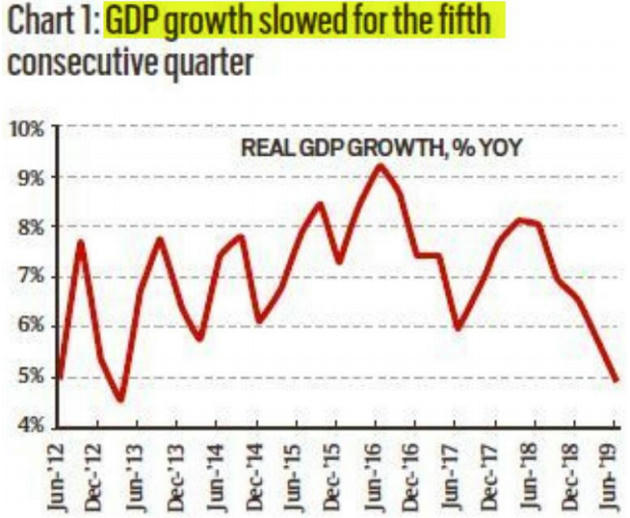
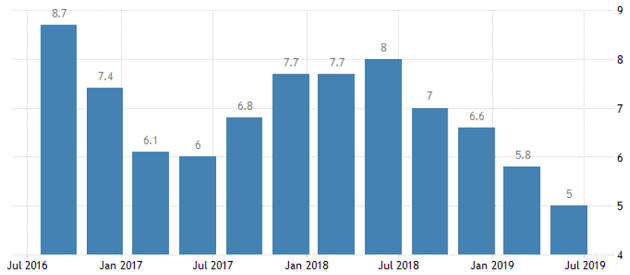
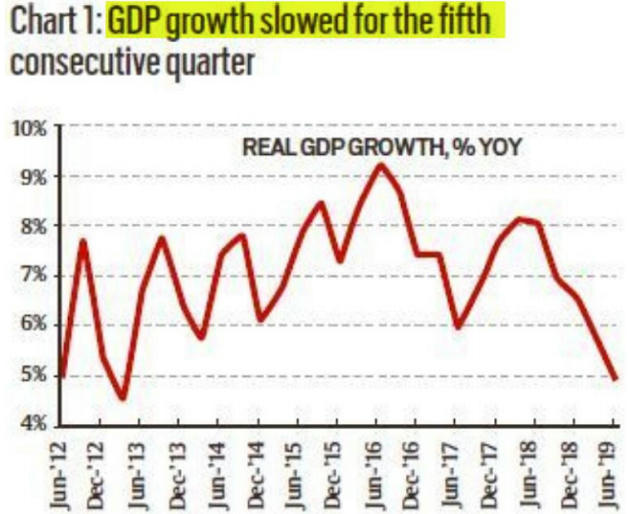
- The Central Statistics Office (CSO) recently released the economic growth data for the first quarter (Q1, or April to June) of the current financial year (2019-20, or FY20).
- The GDP was expected to be around 5.8%.
- But it came as a shock to many when the GDP growth rate of 5% hit a six-year low.
GVA VS GDP
- These are the 2 ways through which CSO estimates economic growth.
- GVA is the calculation from SUPLLY side.
- Whereas the GDP calculation is from the DEMAND side.
GVA CALCULATION
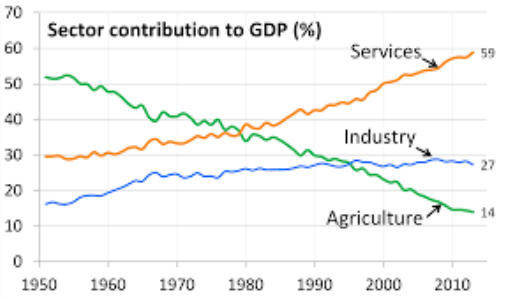
- The sectors in our economy are broadly divided into Agriculture, Industry and Services.
- There are sub-categories too — Industry, for example, has Manufacturing, Construction, Mining & Quarrying, etc.
- All workers in the economy fall into one or the other category.
- When all the value-added is totaled, we get the Gross Value Added (GVA) in the economy.
- In other words, GVA tracks the income generated for all the workers in the economy.
GDP CALCULATION
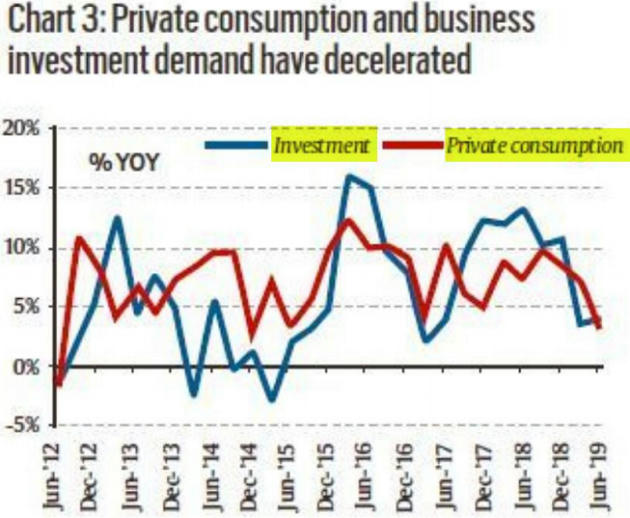
- It is calculated by adding the expenditure made by different categories of spenders.
- There are 4 sources of expenditure in an economy — Private consumption, Government consumption, Business investments, & Net exports.
- Since GDP maps final expenditure, it includes both taxes and subsidies that the government receives and gives.
- This component, net taxes (Taxes – Subsidies), is the difference between GVA and GDP.
WHY GVA IS MORE IMPORTANT?
- GDP is a good measure when you want to compare India with another economy.
- While GVA is better to compare different sectors within the economy.
- GVA is more important when looking at quarterly growth data because quarterly GDP is arrived at by observing the GVA data.
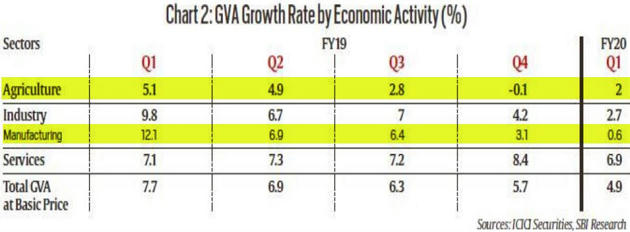
WHY GDP 5%?- THE SUPPLY SIDE STORY
- The GVA in Q1 is pegged at 4.9%.
- This means that producers are not adding enough value.
- Growth in all three sectors has declined.
- But most of the decline is in Agriculture and Industry (specifically- manufacturing).
WHAT THIS MEANS?
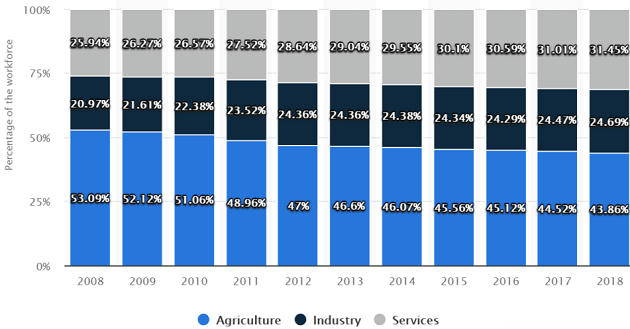
- Agriculture and Industry employ the largest number of people.
- Thus lower growth in agriculture and Industry imply that a bulk of India’s workforce is either not getting jobs, or not seeing their incomes grow.

Latest Burning Issues | Free PDF


 WhatsApp